You can use this single command in Windows PowerShell to install PowerShell 7.
1 |
iex "& { $(irm https://aka.ms/install-powershell.ps1) } -UseMSI" |
Just another Select of Ms SQL DBA site
You can use this single command in Windows PowerShell to install PowerShell 7.
1 |
iex "& { $(irm https://aka.ms/install-powershell.ps1) } -UseMSI" |
List the subfolder sizes in a folder
1 2 3 4 5 |
Get-ChildItem -force '\\servername\sql_backup\BACKUP_OLA' -ErrorAction SilentlyContinue | Where-Object { $_ -is [io.directoryinfo] } | % { $len = 0 Get-ChildItem -recurse -force $_.fullname -ErrorAction SilentlyContinue | % { $len += $_.length } $_.fullname, '{0:N2} GB' -f ($len / 1Gb) } |
Result sample:
1 2 3 4 5 6 7 8 9 10 11 12 13 14 15 16 17 18 |
/# result \\servername\sql_backup\BACKUP_OLA\SQL102249_STS01AI 15.61 GB \\servername\sql_backup\BACKUP_OLA\SQL102318e002b 718.37 GB \\servername\sql_backup\BACKUP_OLA\SQL102250_STS01BI 22.81 GB \\servername\sql_backup\BACKUP_OLA\SQL102318e001b 94.21 GB \\servername\sql_backup\BACKUP_OLA\SQL102184_STSS50E 97.33 GB \\servername\sql_backup\BACKUP_OLA\SQL102249_STS01AP 17.52 GB \\servername\sql_backup\BACKUP_OLA\SQL102250_STS01BP 36.99 GB \\servername\sql_backup\BACKUP_OLA\SQL102318e003c 355.39 GB \\servername\sql_backup\BACKUP_OLA\SQL102318e004b 3312.04 GB \\servername\sql_backup\BACKUP_OLA\SQL102249_STS05AP 1.85 GB \\servername\sql_backup\BACKUP_OLA\SQL102250_STS05BP 2.39 GB \\servername\sql_backup\BACKUP_OLA\AGSQL102318E005 0.90 GB \\servername\sql_backup\BACKUP_OLA\SQL102185_STSS50P 0.07 GB #/ |
Find old files recursively with powershell script:
1 |
Get-ChildItem -path \\servername\fileshare\folder -Recurse -Force -File | Where-Object {$_.LastWriteTime -lt (Get-Date).AddDays(-30)} |
Find the oldest file:
1 |
Get-ChildItem -path \\servername\share\folder -Recurse -Force -File | Sort-Object CreationTime | Select-Object -First 1 |
There is two SQL servers and DTC is enabled both of them.
One SQL server is local and another one is a linked server named test.
Run a Distributed Transaction in SQL server for test purpose:
1 2 3 4 5 6 7 8 9 10 11 12 13 14 15 16 17 18 19 |
USE AdventureWorks2014; Select * from [AdventureWorks2014].[Production].[WorkOrder] where WorkOrderID <100 USE AdventureWorks2014; GO SET XACT_ABORT ON BEGIN DISTRIBUTED TRANSACTION; -- Delete candidate from local instance. DELETE [AdventureWorks2014].[Production].[WorkOrder] WHERE WorkOrderID = 2; -- Delete candidate from remote instance. DELETE test.[AdventureWorks2014].[Production].[WorkOrder] WHERE WorkOrderID = 2; COMMIT TRANSACTION; GO |
after running the T-SQL transaction you can check in the DTC report.
you can check the DTC connection and firewall settings:
DTC ping tool
In powershell:
1 2 3 4 5 |
Test-Dtc -LocalComputerName "$env:COMPUTERNAME" -Verbose Test-Dtc -LocalComputerName "$env:COMPUTERNAME" -RemoteComputerName "SERVER0058" -ResourceManagerPort 17100 -Verbose Test-Dtc -LocalComputerName "$env:COMPUTERNAME" -RemoteComputerName "SERVER0059" -ResourceManagerPort 17100 -Verbose Test-Dtc -RemoteComputerName "SERVER0059" -ResourceManagerPort 17100 -Verbose Test-Dtc -LocalComputerName "$env:COMPUTERNAME" -RemoteComputerName "APPSERVER418" |
If the remote server is another domain, you will get an error:
New-CimSession : WinRM cannot process the request. The following error with errorcode 0x80090322 occurred while using Kerberos authentication: An unknown security error occurred.
In this case you can set: No Authentication Required.
How to enable DTC in SQL server for Java:
– copy sqljdbc_xa.dll to sql server binn folder from the EXTRACTED (but not installed) jdbc driver
– enable xa transactions in component services > computerts > Distributed Transaction Coordinator > Local DTC (properties, security tab) Enable XA transactions
– restart sql server (all components to be sure)
– run script on master db. (xa_install.sql it is also in the jdbc driver, next to the .sql)
– the user that will perform distributed transactions must have the role “SqlJDBCXAUser” set on the MASTER db!
#perf_counters
logman delete %computername%_IO
logman create counter %computername%_IO -c “\LogicalDisk(*)\*” “\Memory\*” “\Network Adapter(*)\*” “\Network Interface(*)\*” “\Paging File(*)\*” “\PhysicalDisk(*)\*” “\Process(*)\*” “\Processor Information(*)\*” -max 512 -f bincirc -si 00:00:01 -ow
logman start %computername%_IO
#etw_trace
C:\msdata\xperf -on PROC_THREAD+LOADER+PROFILE+INTERRUPT+DPC+FILENAME+FILE_IO+FILE_IO_INIT+FLT_IO_INIT+FLT_IO+FLT_FASTIO+FLT_IO_FAILURE+DISK_IO+DISK_IO_INIT -stackwalk Profile+FileCreate+FileCleanup+FileClose+FileRead+FileWrite+FileSetInformation+FileDelete+FileRename+FileDirEnum+FileFlush+FileQueryInformation+MiniFilterPreOpInit+MiniFilterPostOpInit+DiskReadInit+DiskWriteInit+DiskFlushInit -BufferSize 1024 -MinBuffers 256 -MaxBuffers 2048 -MaxFile 4096 -FileMode Circular
logman stop %computername%_IO
C:\msdata\xperf -d C:\msdata\io.etl
Test it, write to the app event log:
Write-EventLog -LogName Application -EntryType Error -Source MSSQLSERVER -EventId 17883 -Message “TEST ERROR EVENT – PLEASE IGNORE IT.”
Test if they are running:
xperf -loggers “NT Kernel Logger”
or
logman query “NT Kernel Logger” -ets
If session exist – trace is running.
Yes, but you need to check:
1 2 3 4 5 6 7 8 9 10 |
SELECT CURRENT_USER; xp_cmdshell 'whoami'; EXECUTE AS user = 'domain\user' SELECT CURRENT_USER; xp_cmdshell 'whoami' xp_cmdshell 'dir \\server\sharename' Revert; -- exit from current user SELECT CURRENT_USER; |
en example for
1 |
logman.exe create counter SQLServerPerf -f bincirc -v mmddhhmm -max 500 -c "\Processor(*)\*" "\LogicalDisk(*)\*" "\Memory(*)\*" "\TCP\*" "\Network Interface(*)\*" "\PhysicalDisk(*)\*" "\Process(*)\*" "\SQLServer:Wait Statistics(*)\*" "\SQLServer:SQL Statistics\*" "\SQLServer:Resource Pool Stats(*)\*" "\SQLServer:Memory Manager\*" "\SQLServer:Memory Node(*)\*" "\SQLServer:General Statistics\*" "\SQLServer:Databases(*)\*" "\SQLServer:Buffer Manager\*" "\SQLServer:Access Methods\*" "\SQLServer:Transactions\*" "\SQLServer:SQL Errors\*" "\ProcessorPerformance\*" -si 00:00:10 |
If you want to investigate a case the default trace setting can be readable for few day and after that they are overwritten.
The default setting is 10 x 100 MB files.
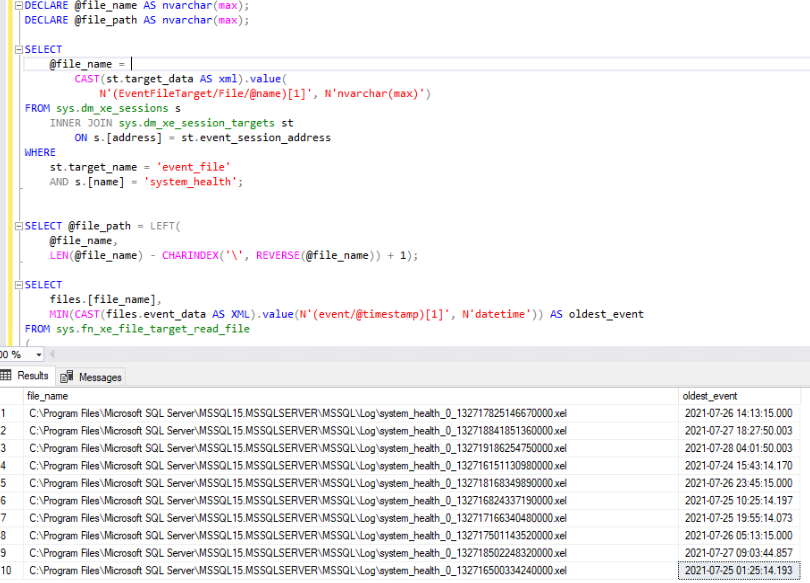
You can check the oldest log:
1 2 3 4 5 6 7 8 9 10 11 12 13 14 15 16 17 18 19 20 21 22 23 24 25 26 27 28 29 |
DECLARE @file_name AS nvarchar(max); DECLARE @file_path AS nvarchar(max); SELECT @file_name = CAST(st.target_data AS xml).value( N'(EventFileTarget/File/@name)[1]', N'nvarchar(max)') FROM sys.dm_xe_sessions s INNER JOIN sys.dm_xe_session_targets st ON s.[address] = st.event_session_address WHERE st.target_name = 'event_file' AND s.[name] = 'system_health'; SELECT @file_path = LEFT( @file_name, LEN(@file_name) - CHARINDEX('\', REVERSE(@file_name)) + 1); SELECT files.[file_name], MIN(CAST(files.event_data AS XML).value(N'(event/@timestamp)[1]', N'datetime')) AS oldest_event FROM sys.fn_xe_file_target_read_file ( @file_path + 'system_health*', null, null, null ) files GROUP BY files.[file_name] OPTION(NO_PERFORMANCE_SPOOL, QUERYTRACEON 8649); |
Hey , it is only 3 days! you have to backup the files. A better solution to survive a long weekend to increase the retention, for example using 30 files:
1 2 3 4 5 6 7 8 |
ALTER EVENT SESSION [system_health] ON SERVER DROP TARGET package0.event_file ALTER EVENT SESSION [system_health] ON SERVER ADD TARGET package0.event_file ( SET filename=N'system_health.xel', max_file_size=(100), max_rollover_files=(30) ) |
I do it for registered servers:
1 2 3 4 5 6 7 8 9 10 11 12 13 14 15 16 17 18 19 20 21 22 23 24 25 26 27 28 29 30 |
Declare @TableIndex table (ServerName sql_variant, DBName nvarchar(128), SchemaName varchar(128), TableName nvarchar (128), IndexName nvarchar (128), index_type_desc nvarchar (60),FragPercent float, record_count bigint, create_date datetime, modify_date datetime); INSERT into @TableIndex exec SP_MSforeachdb @command1 = 'use [?]; IF ''?'' NOT IN (''master'', ''model'', ''msdb'', ''tempdb'', ''Distribution'',''SQLMonitor'') BEGIN SELECT SERVERPROPERTY(''ServerName'') ,DB_NAME() as DBName ,s.[name] AS SchemaName ,t.[name] AS TableName ,i.NAME AS index_name ,index_type_desc ,ROUND(avg_fragmentation_in_percent,2) AS avg_fragmentation_in_percent ,record_count AS table_record_count ,create_date ,modify_date FROM sys.dm_db_index_physical_stats(DB_ID(), NULL, NULL, NULL, ''SAMPLED'') ips INNER JOIN sys.tables t on t.[object_id] = ips.[object_id] INNER JOIN sys.schemas s on t.[schema_id] = s.[schema_id] INNER JOIN sys.indexes i ON (ips.object_id = i.object_id) AND (ips.index_id = i.index_id) where record_count>1000 ORDER BY record_count desc, avg_fragmentation_in_percent DESC END' select * from @TableIndex go |