You don’t need to downloag and install wget.
Instead of it, you run the following in cmd (or in python):
1 2 |
python.exe -m pip install --upgrade pip pip install wget |
Just another Select of Ms SQL DBA site
You don’t need to downloag and install wget.
Instead of it, you run the following in cmd (or in python):
1 2 |
python.exe -m pip install --upgrade pip pip install wget |
Symptoms:
Customer complaining about slow SQL server and event application timeout.
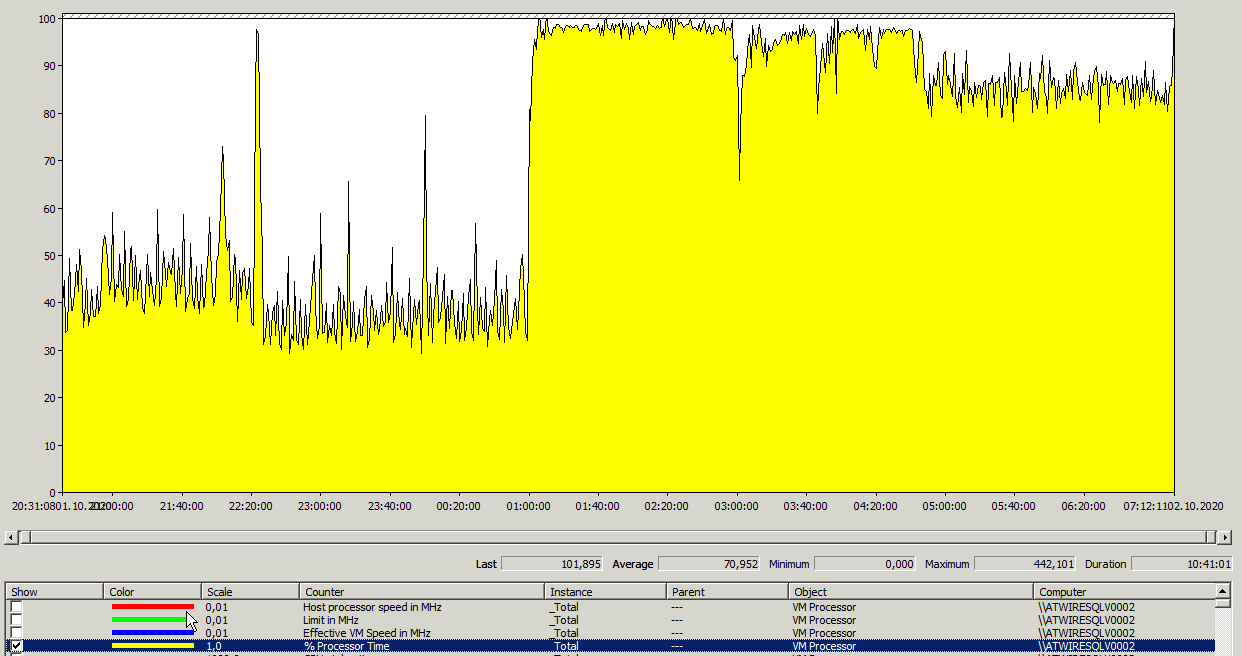
Hihg CPU usage and slow disk with bad disk time response.
Let’s check the the 4 CPU core:
At first glance, it seemed like a heavily used server.
The lack of server resources caused timeouts for the applications.
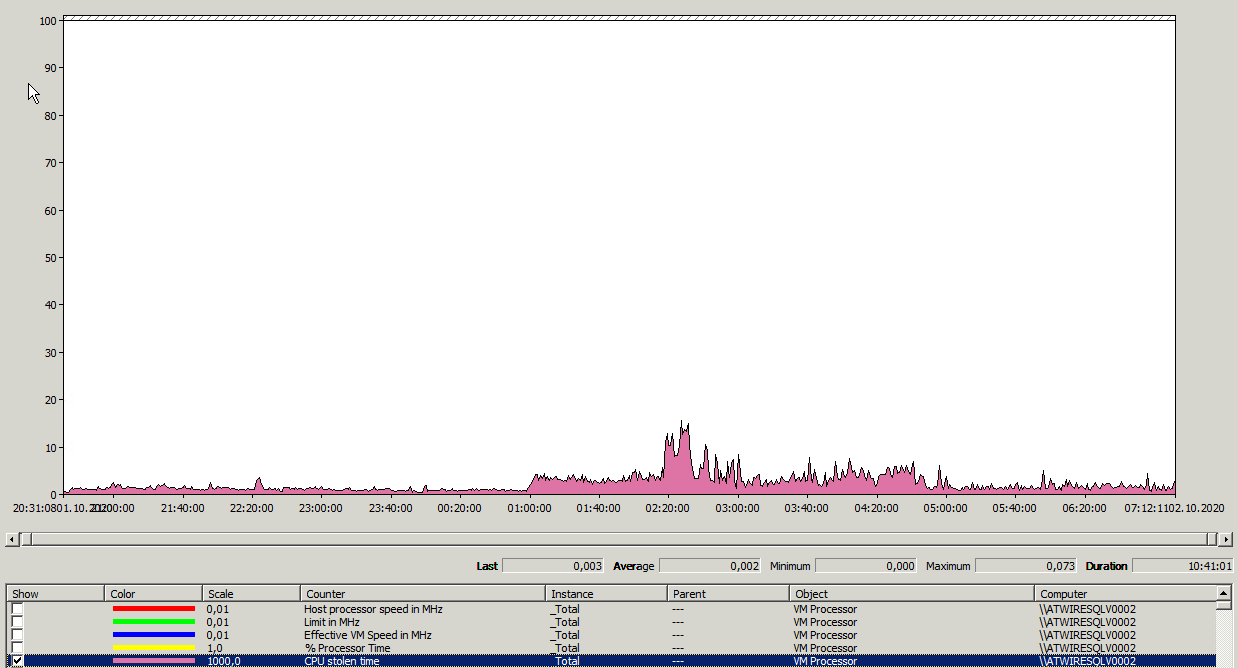
I suspect VMWare virtualization cause performance issue:
Thanks for the teamwork, we found the settings which caused a poor performance: Continue reading “VMWare CPU Limit effect on VM computing and disk speed – CPU stolen time”
Taking notes – some example:
Download and Install to my computer:
Set-PSRepository -Name PSGallery -InstallationPolicy Trusted
Install-Module dbatools
if necessary:
update-module dbatools
OFFLINE:
Copy this directory to offline server:
C:\Program Files\WindowsPowerShell\Modules\dbatools
Set-Location ‘C:\Program Files\WindowsPowerShell\Modules\dbatools’ ##.\install.ps1 ## with internet access
Get-ChildItem -Recurse | Unblock-File
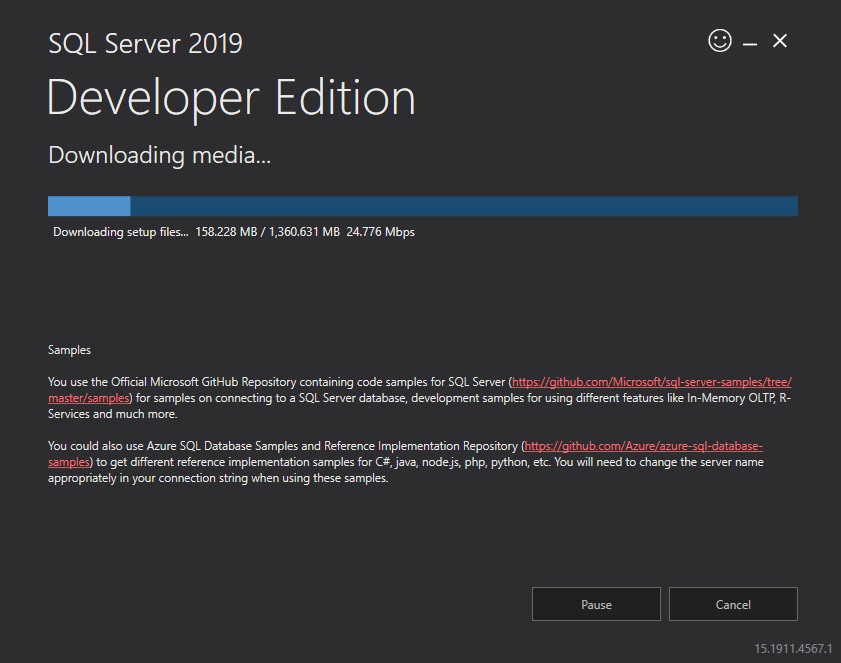
Install SQL Server 2019 Developer Edition – download ISO image and install it offline.
You can download the installer file from:
Start the downloaded SQL2019-SSEI-Dev.exe in an administrator command prompt with the following parameter:
1 |
SQL2019-SSEI-Dev.exe /action=download |
So you can download the ISO image:
The default value of your SQL server is MAXDOP=0. It means there is no limit for parallelism. Your query can use all of your CPU core.
Scenario:
If your SQL Server is not used, than your CPU utilization is low,
your query can use all of the server’s resources.
I run a cross join query in a table which has 40.000 rows.
The server has 8 core.
I set hint for the query to simulate the MAXDOP server setting.
The query and the result:
1 2 3 4 5 6 7 8 9 10 11 12 13 14 15 16 17 18 19 20 21 22 23 24 25 26 27 28 29 |
SELECT SUM(CONVERT(BIGINT, o1.szamolo) + CONVERT(BIGINT, o2.szamolo) ) FROM szamolotabla o1 CROSS JOIN szamolotabla o2 option (maxdop 8) -- result 33520 ms SELECT SUM(CONVERT(BIGINT, o1.szamolo) + CONVERT(BIGINT, o2.szamolo) ) FROM szamolotabla o1 CROSS JOIN szamolotabla o2 option (maxdop 6) -- result 43461 ms SELECT SUM(CONVERT(BIGINT, o1.szamolo) + CONVERT(BIGINT, o2.szamolo) ) FROM szamolotabla o1 CROSS JOIN szamolotabla o2 option (maxdop 4) -- result 59837 ms SELECT SUM(CONVERT(BIGINT, o1.szamolo) + CONVERT(BIGINT, o2.szamolo) ) FROM szamolotabla o1 CROSS JOIN szamolotabla o2 option (maxdop 3) -- result 80219 ms SELECT SUM(CONVERT(BIGINT, o1.szamolo) + CONVERT(BIGINT, o2.szamolo) ) FROM szamolotabla o1 CROSS JOIN szamolotabla o2 option (maxdop 2) -- result 116805 ms SELECT SUM(CONVERT(BIGINT, o1.szamolo) + CONVERT(BIGINT, o2.szamolo) ) FROM szamolotabla o1 CROSS JOIN szamolotabla o2 option (maxdop 1) -- result 232825 |
So if your query use only 1 thread it run longer ( in the example 232 seconds), if it use 8 thread it run much more quicker ( 33 seconds).
So 232/33 ~= 7 . Ok the speed is not 8x , but almost 8. The operating system and other processes use system resources.
Should we use the maxdop value without limit? In the real life a lot of queries run at the same time, so if your query get all of the resource the other waiting the resources. So you try to figure out what is ideal value?
If you have no idea, or don’t have experience with the new databases , you can set the recommended value:
https://support.microsoft.com/en-us/help/2806535/recommendations-and-guidelines-for-the-max-degree-of-parallelism-confi
You can reduce the parallelism in your server with increasing the Cost Threshold for Parallelims.
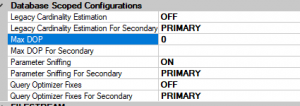
You can set it for individually for every database:
Max DOP for you database and Max DOP For Secondary for your Always ON AG secondary replicas.
I use two script. The firs one is for general purpose and run faster, the second one is good for partitioned table and get many details about partitioned index and table.
1 2 3 4 5 6 7 8 9 10 11 12 13 14 15 |
SELECT OBJECT_NAME(ips.OBJECT_ID) ,i.NAME ,ips.index_id ,ips.partition_number ,index_type_desc ,avg_fragmentation_in_percent ,avg_page_space_used_in_percent ,page_count ,ips.record_count FROM sys.dm_db_index_physical_stats(DB_ID(), NULL, NULL, NULL, 'SAMPLED') ips INNER JOIN sys.indexes i ON (ips.object_id = i.object_id) AND (ips.index_id = i.index_id) -- where OBJECT_NAME(ips.OBJECT_ID) ='table_name' ORDER BY index_id,ips.partition_number,avg_fragmentation_in_percent DESC |
Detailed query for partitioned table:
1 2 3 4 5 6 7 8 9 10 11 12 13 14 15 16 17 18 19 20 21 22 23 24 25 26 27 28 29 30 31 32 33 34 35 36 37 38 39 40 41 42 43 44 45 46 47 48 49 50 51 52 53 54 55 56 57 58 59 60 61 |
/* Script : Index Fragmentation Status (includes Partitioned Tables/Indexes) Version : 1.0 (April 2010) Author : Richard Doering Web : http://sqlsolace.blogspot.com */ - Hide quoted text - SELECT SCHEMA_NAME(o.schema_id) AS SchemaName ,OBJECT_NAME(o.object_id) AS TableName ,i.name AS IndexName ,i.type_desc AS IndexType ,CASE WHEN ISNULL(ps.function_id,1) = 1 THEN 'NO' ELSE 'YES' END AS Partitioned ,COALESCE(fg.name ,fgp.name) AS FileGroupName ,p.partition_number AS PartitionNumber ,p.rows AS PartitionRows ,dmv.Avg_Fragmentation_In_Percent ,dmv.Fragment_Count ,dmv.Avg_Fragment_Size_In_Pages ,dmv.Page_Count ,prv_left.value AS PartitionLowerBoundaryValue ,prv_right.value AS PartitionUpperBoundaryValue ,CASE WHEN pf.boundary_value_on_right = 1 THEN 'RIGHT' WHEN pf.boundary_value_on_right = 0 THEN 'LEFT' ELSE 'NONE' END AS PartitionRange ,pf.name AS PartitionFunction ,ds.name AS PartitionScheme FROM sys.partitions AS p WITH (NOLOCK) INNER JOIN sys.indexes AS i WITH (NOLOCK) ON i.object_id = p.object_id AND i.index_id = p.index_id INNER JOIN sys.objects AS o WITH (NOLOCK) ON o.object_id = i.object_id INNER JOIN sys.dm_db_index_physical_stats (DB_ID(), NULL, NULL , NULL, N'LIMITED') dmv ON dmv.OBJECT_ID = i.object_id AND dmv.index_id = i.index_id AND dmv.partition_number = p.partition_number LEFT JOIN sys.data_spaces AS ds WITH (NOLOCK) ON ds.data_space_id = i.data_space_id LEFT JOIN sys.partition_schemes AS ps WITH (NOLOCK) ON ps.data_space_id = ds.data_space_id LEFT JOIN sys.partition_functions AS pf WITH (NOLOCK) ON pf.function_id = ps.function_id LEFT JOIN sys.destination_data_spaces AS dds WITH (NOLOCK) ON dds.partition_scheme_id = ps.data_space_id AND dds.destination_id = p.partition_number LEFT JOIN sys.filegroups AS fg WITH (NOLOCK) ON fg.data_space_id = i.data_space_id LEFT JOIN sys.filegroups AS fgp WITH (NOLOCK) ON fgp.data_space_id = dds.data_space_id LEFT JOIN sys.partition_range_values AS prv_left WITH (NOLOCK) ON ps.function_id = prv_left.function_id AND prv_left.boundary_id = p.partition_number - 1 LEFT JOIN sys.partition_range_values AS prv_right WITH (NOLOCK) ON ps.function_id = prv_right.function_id AND prv_right.boundary_id = p.partition_number WHERE OBJECTPROPERTY(p.object_id, 'ISMSShipped') = 0 ORDER BY SchemaName ,TableName ,IndexName ,PartitionNumber |
Conquer SQL Server 2019 administration–from the inside out
Dive into SQL Server 2019 administration–and really put your SQL Server DBA expertise to work. This supremely organized reference packs hundreds of time-saving solutions, tips, and workarounds–all you need to plan, implement, manage, and secure SQL Server 2019 in any production environment: on-premises, cloud, or hybrid. SQL Server experts offer a complete tour of DBA capabilities available in SQL Server 2019 Database Engine, SQL Server Data Tools, SQL Server Management Studio, and via PowerShell. Discover how experts tackle today’s essential tasks–and challenge yourself to new levels of mastery.
For Experienced SQL Server Administrators and Other Database Professionals
Adatbázis fájlok méretét ritkán csökkentjük, hiszen többnyire úgy is megtelik új adatokkal , indexekkel. Érdemes csökkenteni a méretet például ha nagyon sok adatot kipucoltunk az adatbázisból és csak nagyon sokára fog újra felhízni..
1 2 3 4 5 6 7 8 9 10 11 12 13 14 15 16 |
-- lényeg, hogy kis adagokban csökkentse a db-t mert soká tarthat és beterhel, valamint trunzactional db is nő!! DECLARE @DataFileName VARCHAR(255); DECLARE @starttime datetime DECLARE @endtime datetime SET @starttime =getdate() SET @DataFileName = (SELECT name FROM sysfiles WHERE groupid = 1); DECLARE @TargetSize INT; SET @starttime =getdate() SET @TargetSize = ROUND(8 * (SELECT size FROM sysfiles WHERE groupid = 1) / 1024, 0) - 500; -- Select current size and substract 500 MB SELECT @DataFileName as datafiename,@TargetSize as targetsize; EXEC ('DBCC SHRINKFILE (' + @DataFileName + ', ' + @TargetSize + ')'); SET @endtime =getdate() SELECT DATEDIFF(millisecond,@starttime,@endtime) AS elapsed_ms; |
Az adatábzis méretet mindig óvatosan csökkentsük, lehet hogy 500 MB üres terület kivétele pillanatok alatt , pár másodperc alatt megtörténik, majd máskor az adatok áthelyezése miatt percekig fut akárcsak 1 MB átszervezése.
Javaslat: kisebb MB-ok csökkentésével kezdjük, majd növeljük a shrink méretet. Amikor elkezd nőni a végrehajtási idő , akkor csökkentsük a shrink méretet.
DevOps környezetben vagy éles környezetben érdemes auditot beállítani. Saját érdekünkben érdemes tudni, hogy ki nyúlt bele és mit csinált!
1 2 3 4 5 6 7 8 9 10 11 12 13 14 15 16 17 18 19 20 21 22 23 24 25 26 27 28 29 30 31 32 33 34 35 36 37 38 39 40 41 42 43 44 45 46 47 48 49 50 51 52 53 54 55 56 57 58 59 60 61 62 63 64 65 66 67 68 69 70 71 72 73 74 75 76 77 78 79 80 81 82 |
CREATE SERVER AUDIT [Audit-20190110] TO FILE ( FILEPATH = N'H:\Audit\' ,MAXSIZE = 100 MB ,MAX_FILES = 500 ,RESERVE_DISK_SPACE = OFF ) WITH ( QUEUE_DELAY = 3000 ,ON_FAILURE = CONTINUE ) ALTER SERVER AUDIT [Audit-20190110] WITH (STATE = ON) GO USE [master] GO CREATE SERVER AUDIT SPECIFICATION [ServerAuditSpecification-20190110] FOR SERVER AUDIT [Audit-20190110] -- ADD (DATABASE_OBJECT_ACCESS_GROUP), ADD (DATABASE_ROLE_MEMBER_CHANGE_GROUP), ADD (SERVER_ROLE_MEMBER_CHANGE_GROUP), ADD (BACKUP_RESTORE_GROUP), ADD (AUDIT_CHANGE_GROUP), ADD (FAILED_DATABASE_AUTHENTICATION_GROUP), ADD (DATABASE_OBJECT_PERMISSION_CHANGE_GROUP), ADD (SCHEMA_OBJECT_PERMISSION_CHANGE_GROUP), ADD (FAILED_LOGIN_GROUP), ADD (DATABASE_MIRRORING_LOGIN_GROUP), -- ADD (LOGOUT_GROUP), ADD (DATABASE_CHANGE_GROUP), ADD (DATABASE_OBJECT_CHANGE_GROUP), ADD (DATABASE_PRINCIPAL_CHANGE_GROUP), ADD (SCHEMA_OBJECT_CHANGE_GROUP), ADD (SERVER_OBJECT_CHANGE_GROUP), ADD (SERVER_OPERATION_GROUP), ADD (LOGIN_CHANGE_PASSWORD_GROUP), ADD (SERVER_STATE_CHANGE_GROUP), ADD (DATABASE_OWNERSHIP_CHANGE_GROUP), ADD (SCHEMA_OBJECT_OWNERSHIP_CHANGE_GROUP), ADD (SERVER_OBJECT_OWNERSHIP_CHANGE_GROUP), ADD (USER_CHANGE_PASSWORD_GROUP) WITH (STATE = ON) GO --Create the database Audit spec CREATE DATABASE AUDIT SPECIFICATION [dbaudit] FOR SERVER AUDIT [Audit-20190110] ADD ( AUDIT_CHANGE_GROUP ) ,ADD ( APPLICATION_ROLE_CHANGE_PASSWORD_GROUP) ,ADD ( BACKUP_RESTORE_GROUP ) ,ADD ( DATABASE_CHANGE_GROUP ) ,ADD ( DATABASE_OBJECT_CHANGE_GROUP ) ,ADD ( DATABASE_OBJECT_OWNERSHIP_CHANGE_GROUP ) ,ADD ( DATABASE_OBJECT_PERMISSION_CHANGE_GROUP ) ,ADD ( DATABASE_PERMISSION_CHANGE_GROUP ) ,ADD ( DATABASE_PRINCIPAL_CHANGE_GROUP ) ,ADD ( DATABASE_ROLE_MEMBER_CHANGE_GROUP ) ,ADD ( DBCC_GROUP ) ,ADD ( FAILED_DATABASE_AUTHENTICATION_GROUP ) ,ADD ( SCHEMA_OBJECT_CHANGE_GROUP ) ,ADD ( SCHEMA_OBJECT_OWNERSHIP_CHANGE_GROUP ) ,ADD ( DATABASE_ROLE_MEMBER_CHANGE_GROUP ) ,ADD ( SCHEMA_OBJECT_PERMISSION_CHANGE_GROUP ) -- 2012-newer allowed events ,ADD ( FAILED_DATABASE_AUTHENTICATION_GROUP ) ,ADD ( USER_DEFINED_AUDIT_GROUP ) --,ADD ( SUCCESSFUL_DATABASE_AUTHENTICATION_GROUP ) WITH ( STATE = ON); GO SELECT event_time ,action_id ,session_server_principal_name AS UserName ,server_instance_name ,database_name ,schema_name ,object_name ,statement FROM sys.fn_get_audit_file('H:\Audit*.sqlaudit', DEFAULT, DEFAULT) -- WHERE action_id IN ( 'SL', 'IN', 'DR', 'LGIF' , '%AU%' ) |
Default Null értékű oszlopok , ahol minden Null értékű:
1 2 3 4 5 6 7 8 9 10 11 12 13 14 15 16 17 18 19 20 21 22 23 24 25 26 27 28 29 30 31 32 33 34 35 36 37 38 39 40 41 42 43 44 |
-- Returns a list of all columns in current database -- where the column's value is null for all records. declare @tempTable TABLE ( TableSchema nvarchar(256), TableName nvarchar(256), ColumnName sysname, NotNullCnt bigint ); declare @sql nvarchar(4000); declare @tableSchema nvarchar(256); declare @tableName nvarchar(256); declare @columnName sysname; declare @cnt bigint; declare columnCursor cursor FOR SELECT TABLE_SCHEMA, TABLE_NAME, COLUMN_NAME FROM INFORMATION_SCHEMA.COLUMNS WHERE -- TABLE_NAME ='tablename' and IS_NULLABLE = 'YES'; open columnCursor; fetch next FROM columnCursor INTO @tableSchema, @tableName, @columnName; while @@FETCH_STATUS = 0 begin -- use dynamic sql to get count of records where column is not null SET @sql = 'select @cnt = COUNT(*) from [' + @tableSchema + '].[' + @tableName + '] where [' + @columnName + '] is not null'; print @sql; --uncomment for debugging exec sp_executesql @sql, N'@cnt bigint output', @cnt = @cnt output; INSERT INTO @tempTable SELECT @tableSchema, @tableName, @columnName, @cnt; fetch next FROM columnCursor INTO @tableSchema, @tableName, @columnName; end close columnCursor; deallocate columnCursor; SELECT * FROM @tempTable WHERE NotNullCnt = 0; |